中国城市主城区棚户区人口占比估算
Estimates of population living in shantytowns as a percentage of main urban district residents in cities in China
对应目标:11.1 到 2030 年,确保人人获得适当、安全和负担得起的住房和基本服务,并改造贫民窟。
成果亮点
- 采用国产高分2 号(GF-2)卫星数据与深度学习语义分割模型(Deeplab V3+),首次实现2019 年中国27 个城市主城区棚户区空间范围提取与识别。
- 结果显示:2019 年中国27 个城市主城区棚户区面积共计124.49 km2,棚户区人口约103.20万人;东西部城市棚户区面积和人口占比差异显著,其中广州和海口棚户区人口超过3%,西安、兰州和西宁棚户区面积超过3%,这些城市面临较大的棚户区改造压力,急需有序进行更新和改造。
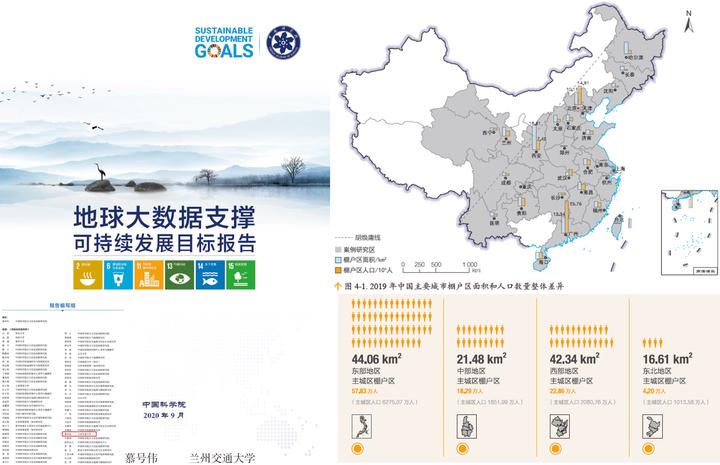
2019 年中国27 个城市主城区棚户区面积为124.49km2,棚户区人口数量103.18 万人(图4-1)。对中国四大经济区分析表明:东部地区主城区棚户区面积为44.06km2,棚户区人口57.83 万人;中部地区主城区棚户区面积21.48 km2,棚户区人口18.29 万人;西部地区主城区棚户区面积42.34 km2,棚户区人口22.86 万人;东北地区主城区棚户区面积16.61 km2,棚户区人口4.20 万人。
Shantytowns in the main urban districts of the 27 Chinese cities covered an area of 124.49 km2 with a total population of 1.032 million in 2019 (Fig. 4-1). There were significant differences among China’s four economic regions (East, Central, West, and Northeast China) in the proportions of AST and PST to those of main urban districts. Specifically, East China had the largest shantytown areas of 44.06 km2 and 578 300 dwellers. West China ranked second, with 42.34 km2 in area and 228 600 dwellers. The shantytowns in Central China covered an area of 21.48 km2 with 182 900 dwellers, while those in Northeast China were 16.61 km2 and had 42 000 people.
慕号伟
Master of Remote Sensing
My research interests include distributed sustainability, biodiversity and deep learning.